Let’s talk ACoS
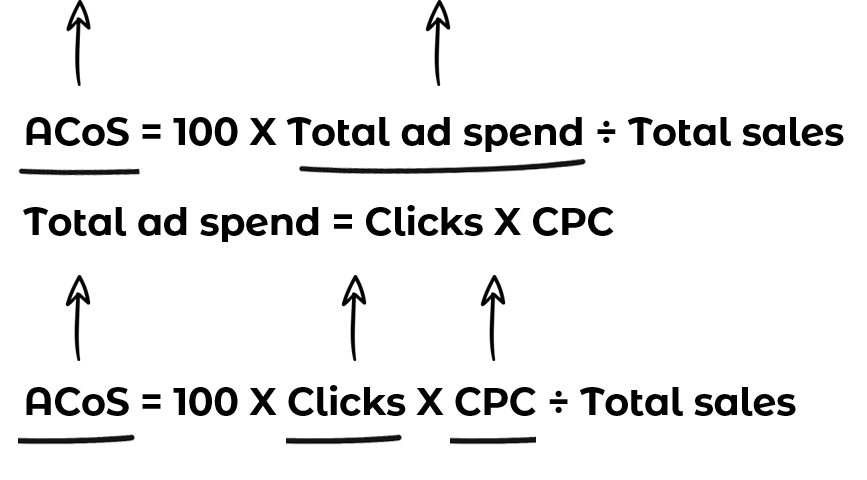
ACoS, Advertising cost of sale, is one of the important metrics for the success of Sponsored Product Ad campaigns. For some sellers it’s the exclusive metric.
Although there is plenty to say about the ACoS for the sellers, about the fact that it’s wrong to relate to only one metric, that a campaign has many other goals that should be measured differently, that the product page has a huge impact on conversions and therefor on the ACoS, that there are ways to get better ACoS etc’ we are not going to discuss any of it now.
In this post we are going to discuss the ACoS from the store point of view.
Making everybody happy
On the one hand the store wants to keep the advertisers happy and reach good results with low ACoS but on the other hand it wants to maximize it’s revenue from selling ads. Higher ACoS aligns with this goal.
The store can affect the ACoS by setting minimum bids for the campaigns and by offering automatic bidding campaigns that target a fix ACoS (we will elaborate later) that would raise the CPC.
So what should be the balanced ACoS that could keep both the sellers and the store happy?
The Nash equilibrium
A performance driven advertiser will keep running Sponsored Product Ads as long as his ACoS is lower than it’s profit margin. When it’s getting too high many sellers would change their bids, remove products or keywords from the campaign, reduce the budget or eventually stop their campaigns and the remaining will be those who are interested in other goals such as awareness and branding.
Another factor that impacts the seller is the ACoS they can get in alternative channels and stores. A seller would rather spend his budget in stores with better ACoS where every dollar that is spent generates more revenue.
The store should target the highest possible ACoS that doesn’t push sellers away and doesn’t affect negatively on the CPC or clicks.
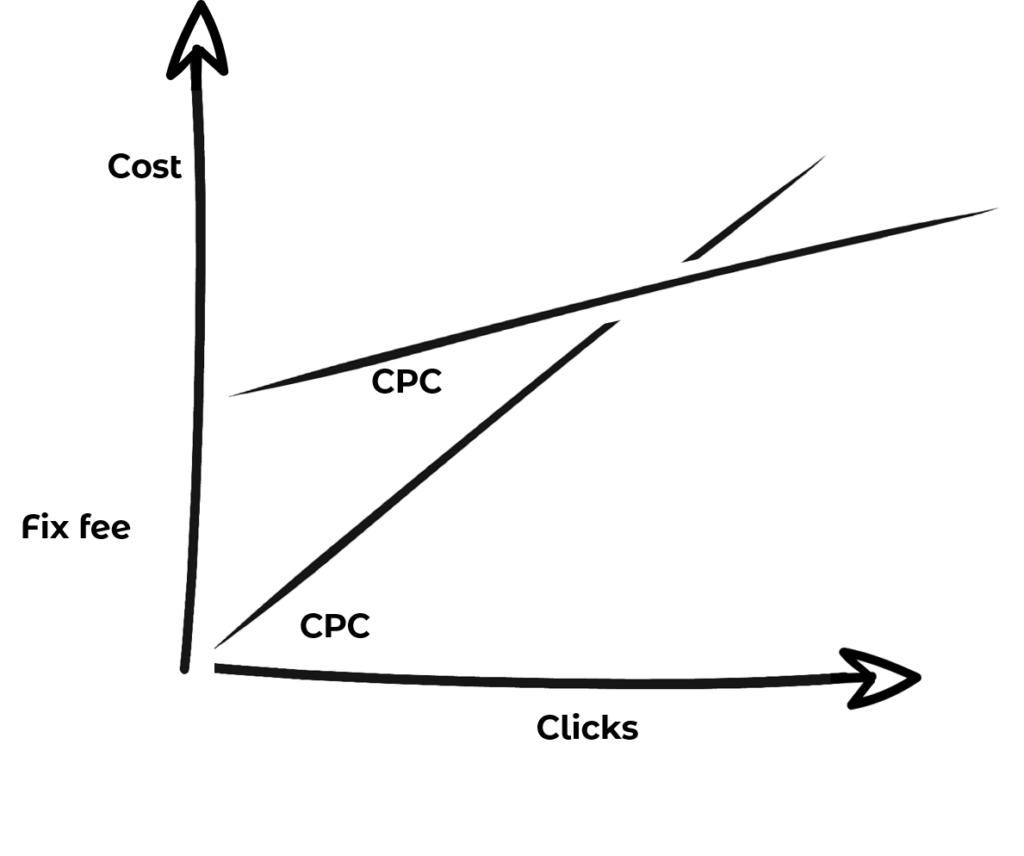
Another option for the store is to maintain a relatively low ACoS but add a fix fee to the sellers that want to run campaigns.
The Amazon Benchmark
According to adbadger the average ACoS on Amazon is 34.4%.
An ACoS under 25% is considered a good ACoS. If it’s between 25% and 40% it’s considered average and if it is higher than 40% it’s considered high.
The average ACoS changes from one vertical to another (based on the prices of the products in the vertical and the competition).
Now let’s do some math:
Assuming that the average ACoS on Amazon is 30% and knowing that in 2019 it generated $14B from selling ads it means that the GMV that was triggered by ads is $46.7B. That’s 33% of the total GMV ($140B).
What about Google Shopping ads?
Here are some interesting findings that were published by Sidecar earlier in 2019 and regarding 2018.
The information is based on a representative sample of U.S. retailers of varying sizes and verticals that had active Google Shopping campaigns in 2017 and 2018 and the findings are based on Google Ads data.
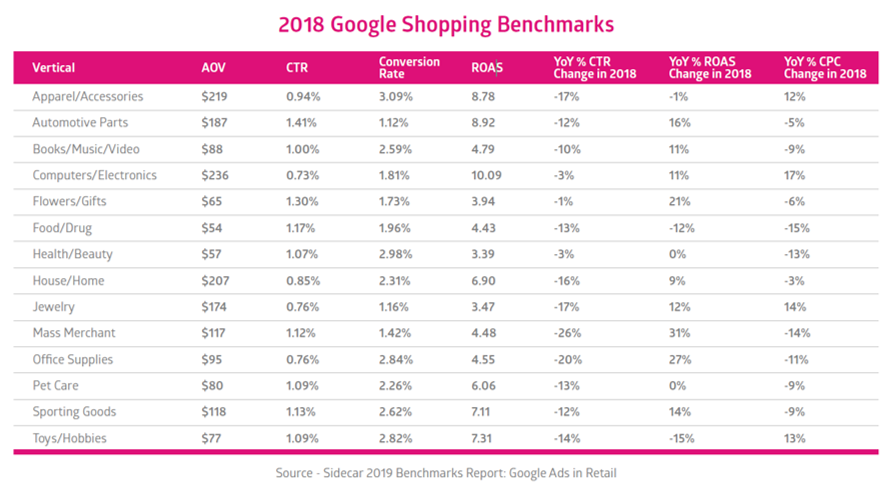
The ACoS is not represented in the chart but the ROAS (Return on ad spend) which is the multiplicative inverse is here.
Similar to the findings of Sellics (Amazon sponsored product ads) the consumer electronics and computer category is performing well in terms of ACoS (or ROAS), but in most of the other categories the findings are not coherent (take Pet Care for example).
The Pareto of ACoS
It’s important to be aware that not all advertisers will get good ACoS even if the average ACoS of the store is good.
In fact for some advertisers and in some verticals it’s almost impossible to get good AcoS.
Just like the classical Pareto principle – The store should know who are the 20% of the advertisers that generate 80% of the ad revenue and usually get a good ACoS and focus on them instead of wasting time trying to help some long tail advertisers reach better ACoS which might be impossible.
A year ago during Etsy’s earning call this is what they said about their promoted listing adoption:
“So it’s 16% of sellers have adopted Promoted Listings. I would call out that not all sellers are equal in terms of their sales on Etsy. And so one thing we’ve talked about in the past is that some of our largest sellers are disproportionately represented on Pro List.
I just want to caution us away from thinking that the number one way to grow Pro List is to grow the percentage of sellers that are currently adopting it. We’ve shared that the amount of investment capacity they have given us is well in excess of our ability to spend it. So that gives you some sense of adding more sellers may not directly translate into driving more Pro List sales, it’s more around improving the relevance of our algorithms and bidding engines and things like that.”
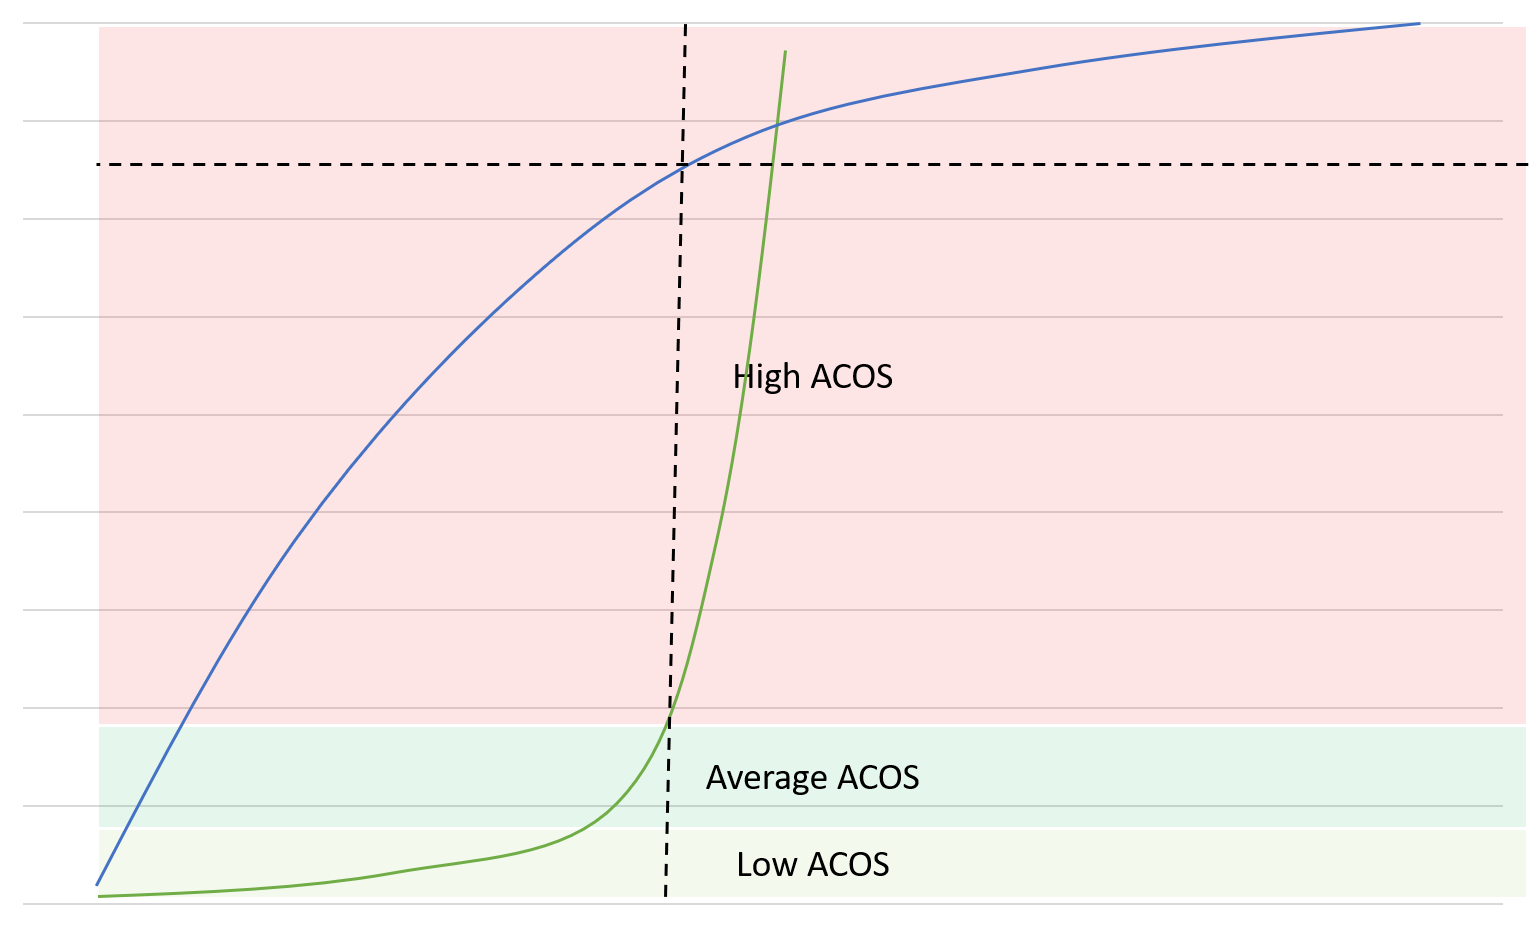
This chart presents a real example of the ACoS and the cumulative ad spending of advertisers in a big marketplace.
- The blue line presents the cumulative ad spending of the advertisers.
- The green line presents the ACoS of the advertisers.
- The X-axis presents the number of advertisers.
As you can see a smaller percentage of the advertisers (left to the broken line) is getting a low or average ACoS but the majority of the advertisers (right to the broken line) is getting a high ACoS.
However that minority (with the low or average ACoS) is generating most of the Ad revenue for the store (the blue line).
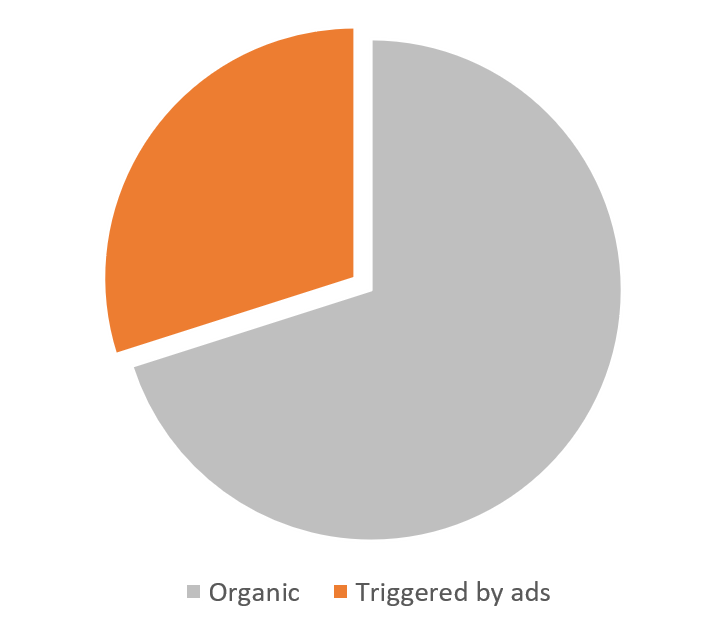
Now let’s also look at the cumulative GMV that is generated by the ads.
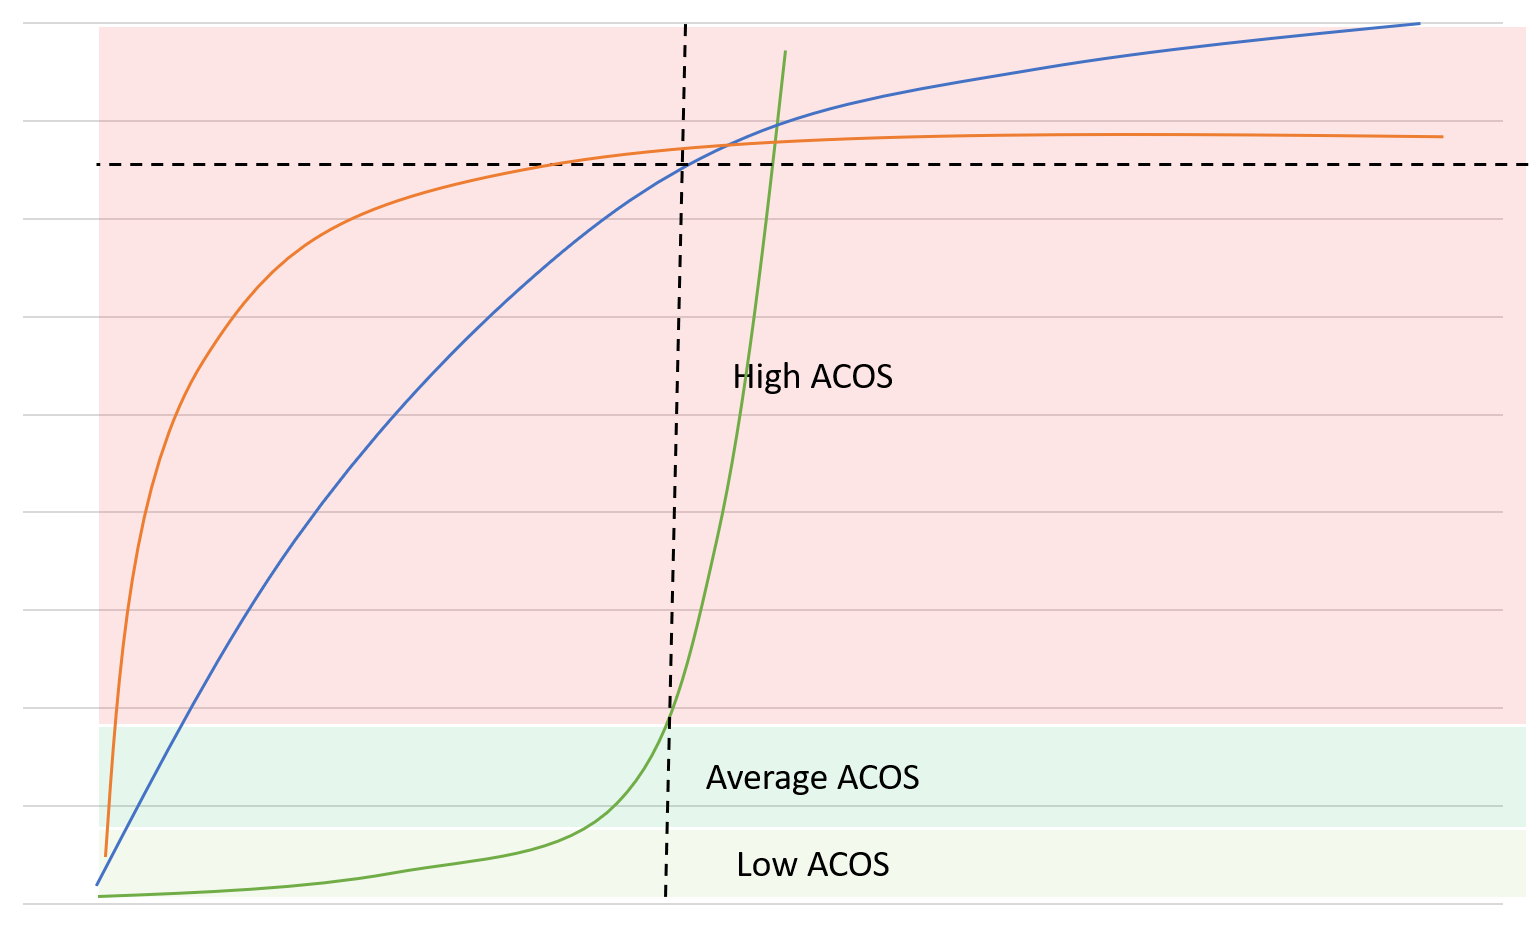
The Orange line presents the cumulative GMV that was generated from the ads.
Now you can see that those with the low ACoS are generating almost all of the sales!
- 33% of the sellers that are running campaigns are generating a good ACoS and responsible for almost 100% of the GMV!
- The 10% of the sellers that are running campaigns and getting the lowest are generating almost 70% of the GMV!
- The 20% of the sellers that are running campaigns and getting the lowest ACoS are generating almost 85% of the GMV!
If the store could double the ACoS for these sellers they would still get good results (average or low ACoS) and the store would generate more revenue from the ads.
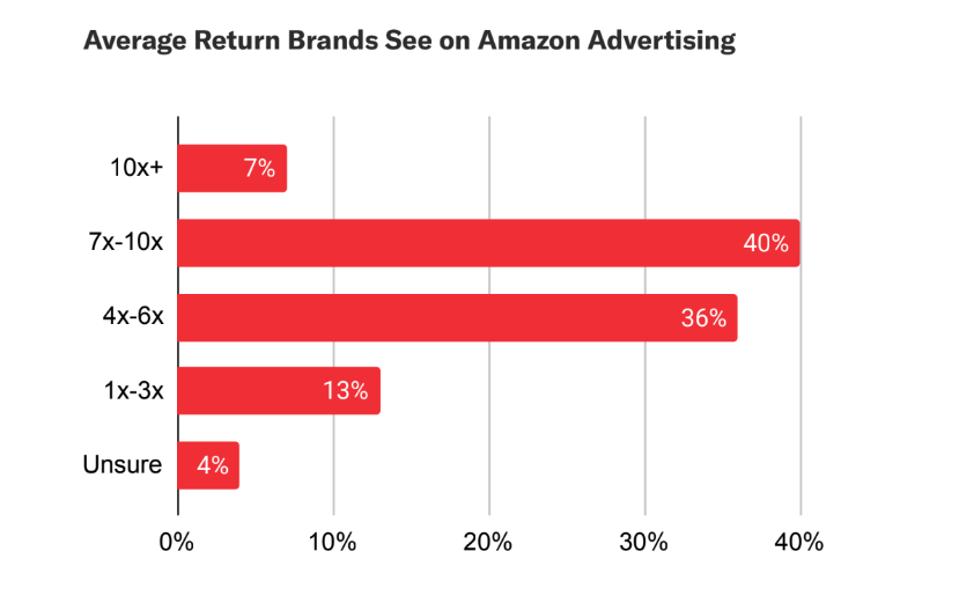
A recent report that was published by Feedvisor and surveyed big U.S. retail brands with more than $10 million in annual revenue and run ads on Amazon found that nearly half (47%) of the brands see a max ACoS of 14% (700% ROAS). The others are getting higher ACoS.
However this survey does not include the smaller and long tail sellers who are not reaching $10 million in annual revenue.
How can the store influence the ACoS?
The average ACoS differs from store to store and depends on the competition, the price per click, the territory, the bidding method, the vertical, the brands and vendors that are selling on it etc.
There are marketplaces with an average ACoS of 4% and others with 40%.
The store can increase the average ACoS in 3 main ways:
(1) increasing the min bid – That means that when there is no competition on a certain keyword or category the price per click will be higher.
(2) Increasing the default ACoS for the automatic campaigns – That means that in automatic campaigns where the bids are done automatically (trying to reach a target default ACoS) the CPC will be higher.
(3) Changing the auction method (1st price auction for example or other options).
Imagine that a store with a 4% average ACoS manages to increase to 8% (which is still way below Amazon and a very good ACoS for the advertisers). This can double the revenue that the store generates from Sponsored Product Ads.
The seasons of the year
The ACoS also changes throughout the year.
During Black Friday 2019 for example despite the strong competition and higher CPC’s, in most categories and in most stores, the average ACoS was 50%-150% lower than the average in October.
In the toys category, some consumer electronics categories and some of the accessories categories (products that are given as gifts on Christmases) it was 3 times lower or even more than that.
For more examples on 2019 Black Friday results read this post.
According to Adbadger the average ACoS varies between 20% to 40% depends on the month of the year.
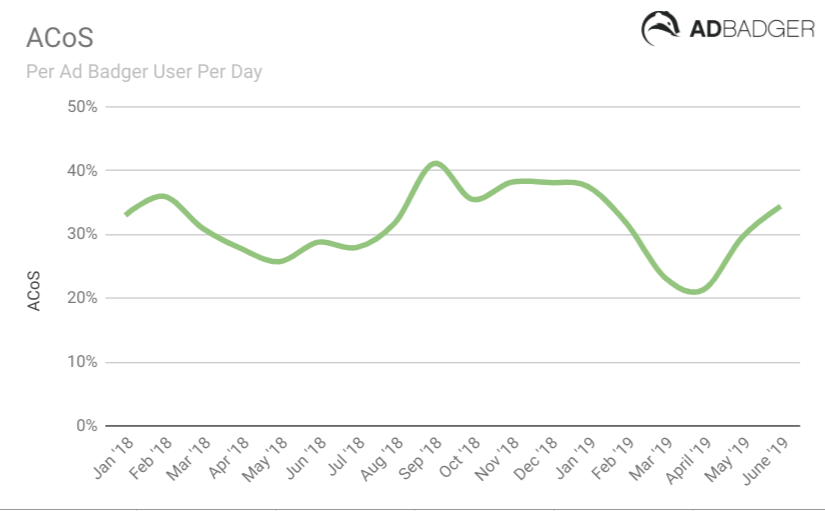
This is based on the data coming from sellers that use Adbadger.
Footnote – Introducing TACoS
TACoS, Total Advertising Cost of Sale, measures the advertising spend relative to total revenue generated (not just the revenue that was generated directly by the ads). This gives sellers and brands an holistic picture of how their ads performed.
TACoS allows advertisers to measure the effect of the ads on the long-term growth and on the organic sales.
About Mabaya:
Mabaya’s Sponsored Product Ads platform is a white label solution for marketplaces and online retailers who want to run their own ecommerce media and enable their sellers and brand partners to promote their products within the store. The company has vast experience in the ecommerce media space, serving billions of Sponsored Product Ads for major ecommerce sites and investing more than 5 years in developing and updating the platform.
If you want to consult your ACoS and eCommerce media business give us a call or meet us at Shoptalk.