
Fill rate – Why is it so important and irrelevant?

“Do you want me to add more ads in the page?” Said the product manager to the monetization manager and then continued without waiting for an answer: “Let’s see you sell the ad space that you already have, mister. You have a fill rate of 63% so you can still sell 37% of the current ad inventory”.
Well, Watson, our product manager friend, you are absolutely right but at the same time you are 100% wrong.
This post will help you, monetization people, provide the proper answer.
What is fill rate?
Fill rate is the percentage of ad impressions your ads receive, divided by the total ad requests and multiplied by 100%.
A low fill rate can indicate that the ecommerce website has too much supply (pageviews and ad slots) but not enough demand (advertisers).
For publishers (in our case ecommerce websites), the aim is to monetize each and every page view at the best possible price so a reasonable conclusion would be that the ecommerce website should increase the demand (look for more advertisers) to meet the supply and that there is no need to add more touchpoints and ads in the page until the current supply is filled (as the smart product manager claimed).
The first part of the conclusion is correct – you should try to find advertisers to fill all your ad inventory especially in the long tail categories.
The second part is wrong. Don’t expect to have 100% fill rate before thinking about adding more touch points.
How many ads do you have for green over-ear headphones?
If you search for “blue over ear headphones” on Amazon you would get these results: One sponsored brand ad (3 products), followed by 2 sponsored product ads, then 3 organic results, a carousel of highly rated sponsored products (5 products), another sponsored brand ad (1 product), 1 organic result, 1 sponsored, 4 organic, 1 sponsored, 4 organic, 1 sponsored, 4 organic and 1 sponsored. Altogether on this page you would find 15 sponsored products and 16 organic products.
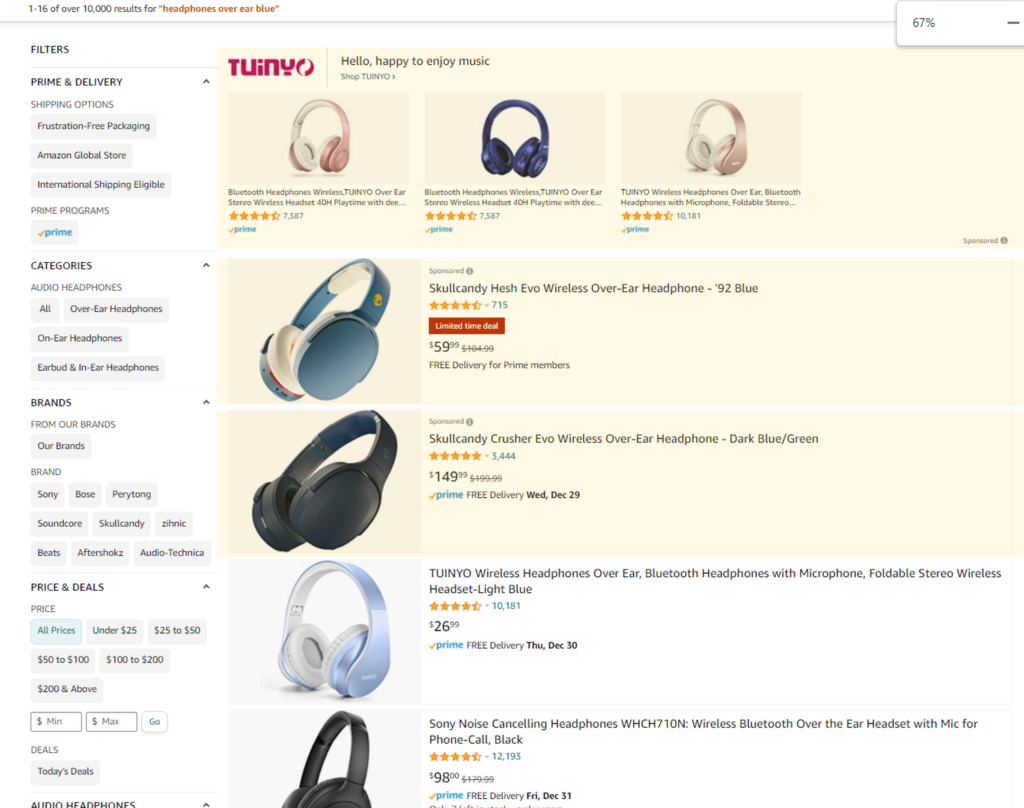
At the same time if you search for “green over ear headphones” you would get one sponsored brand ad that is not relevant (2 products that are not over ear and not green), 2 sponsored product ads (both of them are not green), 3 organic results (green over ear headphones), 1 sponsored brand ad (for one product that is not green also), 1 organic result, 1 sponsored (green), 4 organic, 1 sponsored, 4 organic, 1 sponsored, 4 organic and 1 sponsored (black). Altogether in this page you can find 9 sponsored products (3 are actual green over ear headphones) and 16 organic products.
So what is Amazon’s fill rate?
Let’s say that the case of the blue over ear headphones represents a 100% fill rate. All ad slots are filled. It means that for green headphones the fill rate is 9/15 (60%) and if Amazon’s sponsored product ads were 100% strict (only green over ear headphones would be served) then the fill rate would have been 3/15 (20%).
So what is Amazon’s advertising fill rate?
It’s not 100%, that’s for sure.
Does that mean Amazon shouldn’t add more ads in a search result page? Not really.
There will never be 100% fill rate because sponsored product ads are related to search terms. There will always be some popular generic search terms that will trigger tons of relevant ads (TV, headphones, iPhone cover etc.), some less popular and more specific search terms that would trigger less ads (like over ear earphone) and some even more specific that will trigger even less ads (like green over ear headphones).
By definition, the long tail will never generate 100% fill rate. It’s the long tail. There are less products in these niche long tail areas of the store and less ads that promote them.
The 100% fill rate myth
Here is an example from a big marketplace that shows the correlation between the fill rate of each category and it’s total ad requests (that demonstrate the size and the potential ad revenue from each category):
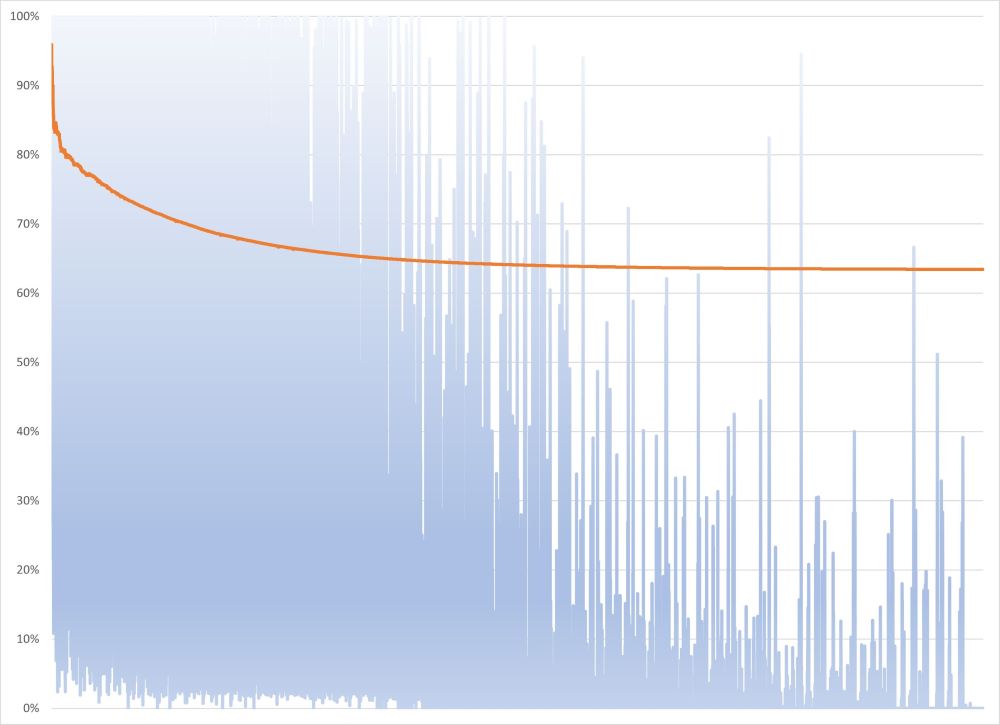
The categories are presented in the X axis and are sorted by the number of ad requests – from the category with the highest number of ad requests to the one with the lowest. The Y axis presents the fill rate (%).
The blue area shows the fill rate of each category while the orange line shows the cumulative fill rate (total imp of all the counted categories divided by the total ad requests in these categories).
As you can see the store’s overall fill rate is ~63%, however there are many categories (especially the most popular ones on the left side of the chart which have the highest number of ad requests) that have 100% fill rate or close to 100%.
These categories also generate the majority of the ad revenue and have the highest CPC’s (as they are very competitive).
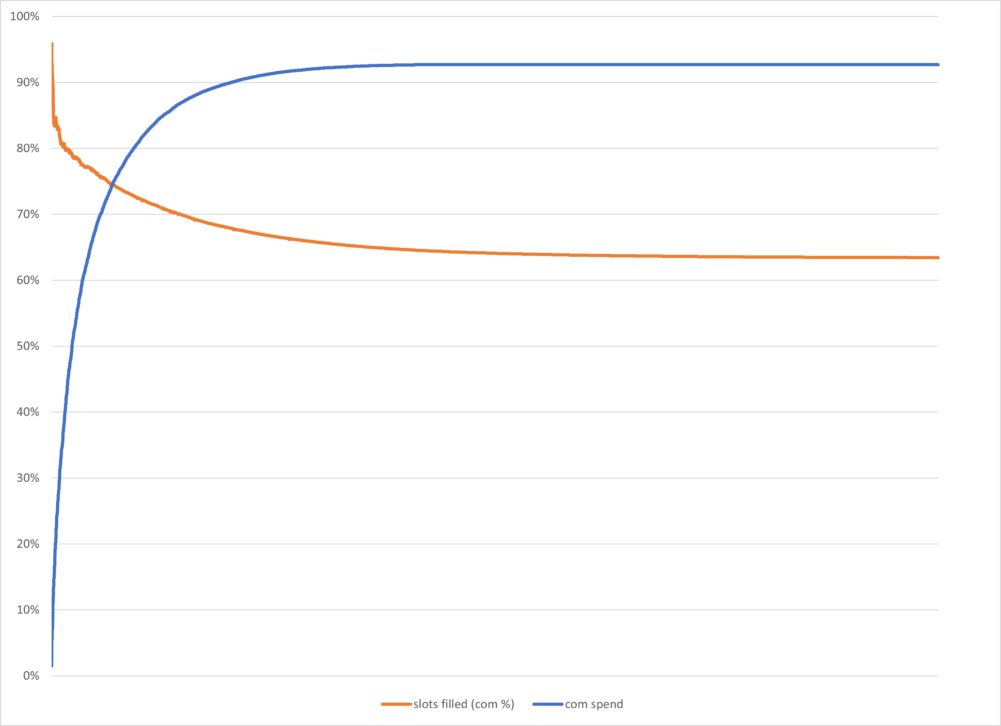
The blue line presents the total ad spend vs. the fill rate (in orange).
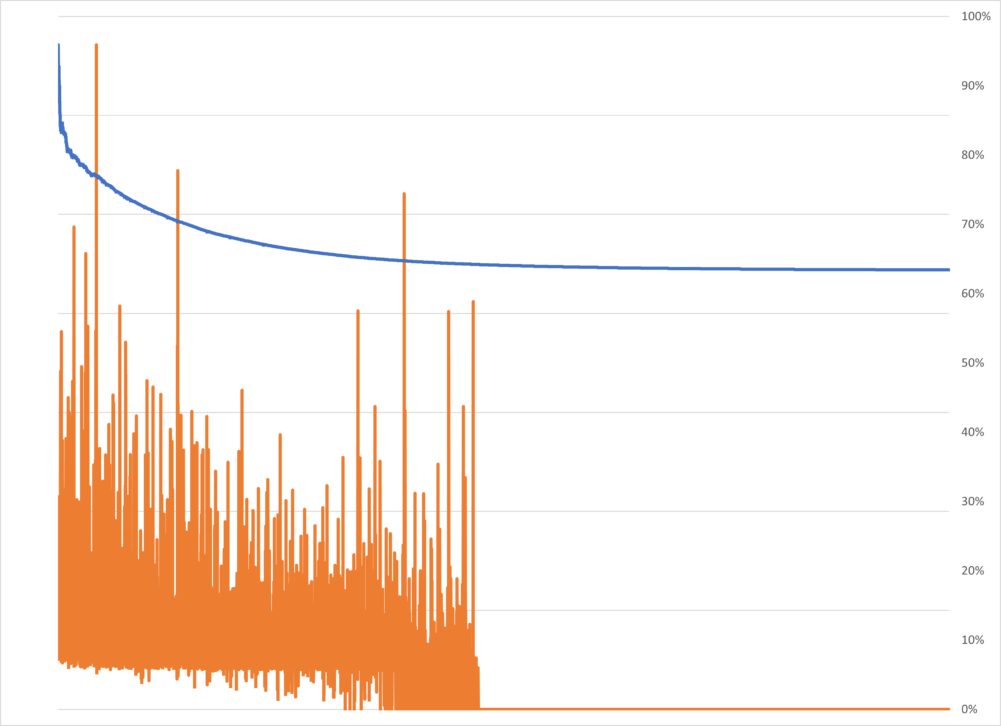
The orange lines present the CPC of each category vs. the fill rate (in blue).
You can see that in most of the categories there are no ads at all (the right side of the chart). These are long tail categories with few products and sellers.
Add more ads
If the store from the example currently offers 2 ad slots on a page and would now add another one (assuming the current fill rate per categories remains the same) the ad revenue could increase by 50%. Even if the fill rate would decrease a bit, it would still generate significant incremental ad revenue.
How would that effect the empty long tail categories or those that are not yet reaching 100% fill rate? They will most likely remain the same and have a worse fill rate (as they now have 3 slots to fill and they are still not able to fill even one) but why should that prevent the store from increasing the ad revenue?
Fill rate – What is it good for? Absolutely something
Does that mean that by adding more ads you can forget about the categories with low fill rate and just sit back?
No way!
You should definitely work on finding more demand for these categories, but you should do it in parallel to adding slots in the categories that are working well and are over populated with ads.
Optimize your revenue from the categories with high fill rate (by adding more ads) and in the meantime optimize your revenue from the categories with low fill rate (by attracting more demand).
Use the category fill rate report to filter the categories with low fill rate and then prioritize your efforts by the size of the opportunity (sort the low fill rate categories by the number of ad requests).
There is another very important issue that you should be aware of. 100% fill rate does not guaranty that you are optimizing your ad revenue.
As said at the beginning, your goal is to “monetize each and every page view at the best possible price”. Fill rate covers the “each page view” but you shouldn’t forget the other part: “the best possible price”. You might have a category with 100% fill rate but only one advertiser that is paying the min bid. By adding other advertisers your ad revenue from this category can increase dramatically.
Final words
So what do you tell the product manager who asks you to reach 100% fill rate before adding more sponsored product ads?
https://www.youtube.com/watch?v=W3fqpMtPNXQ
Or just send them this link: https://www.mabaya.com/fill-rate-why-is-it-so-important-and-irrelevant/.
About Mabaya
Mabaya offers a white-label self-service Sponsored Products Ads platform for online retailers and marketplaces that enables sellers and brands to bid in order to ensure their products are listed in premium locations in the online store.
The platform is integrated in more than 50 ecommerce sites around the globe (such as Bol.com, Jumia, Manomano, Kaufland, Hepsiburada, Falabella etc.), serving more than 70,000 advertisers and sellers.