
Some eCommerce related info-graphics
|27 Oct
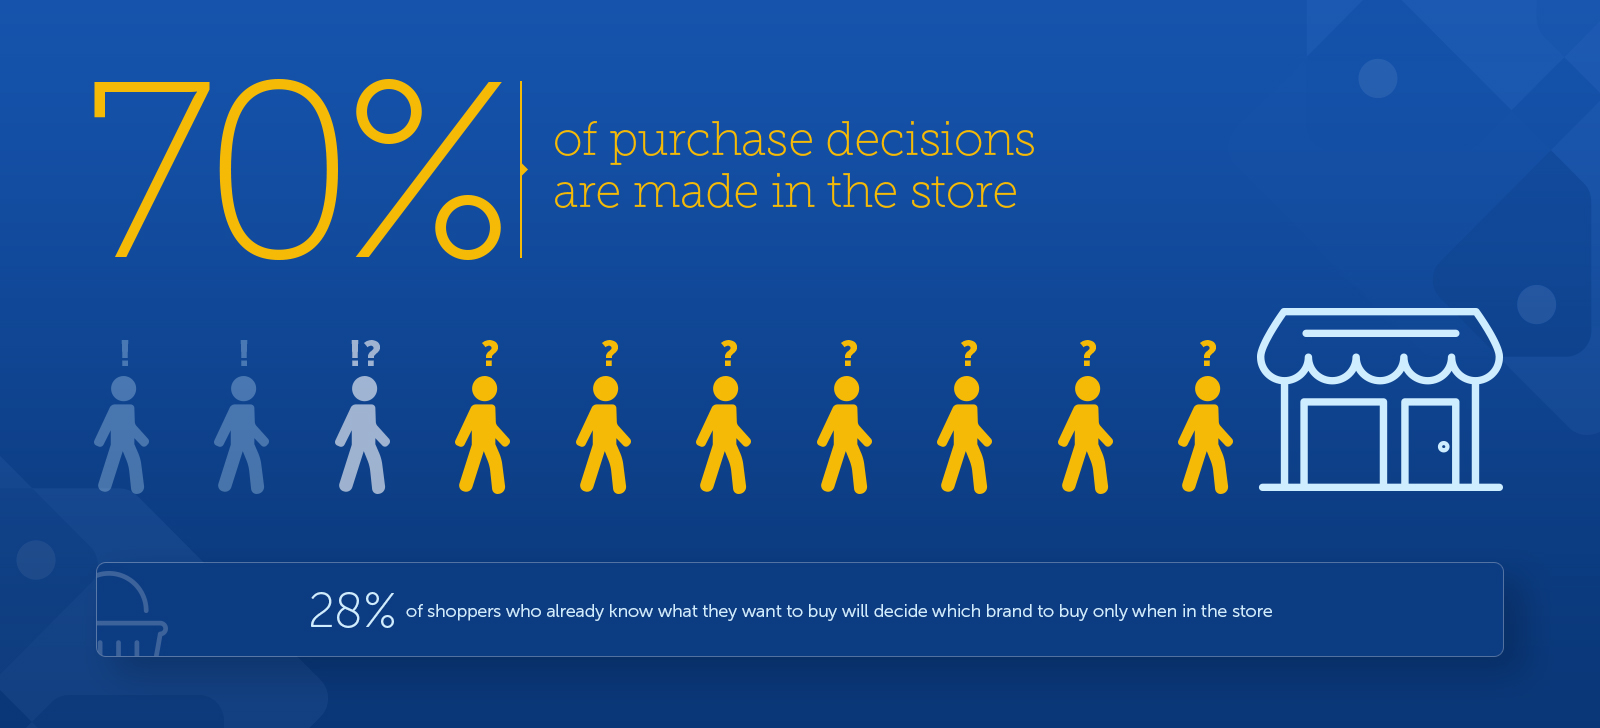
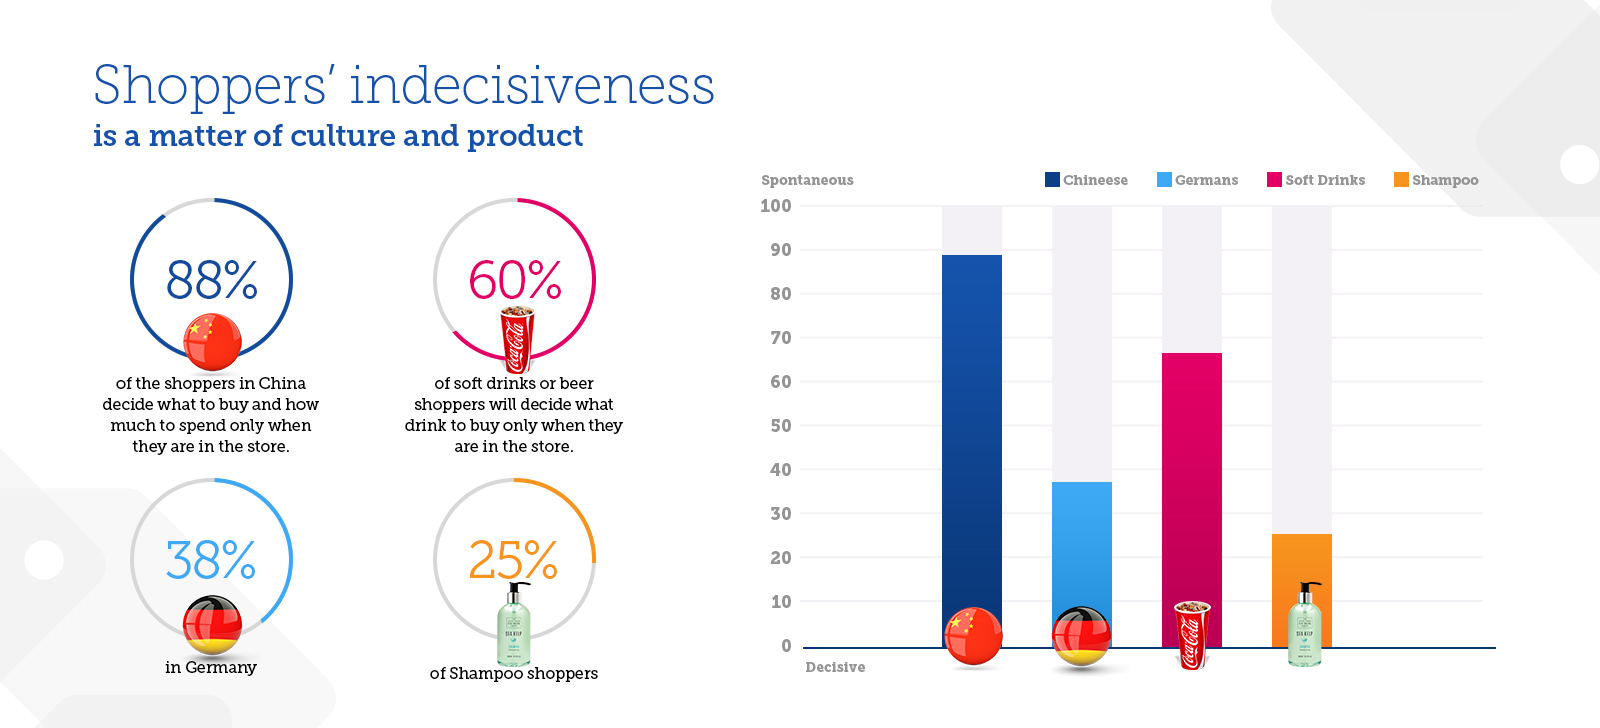
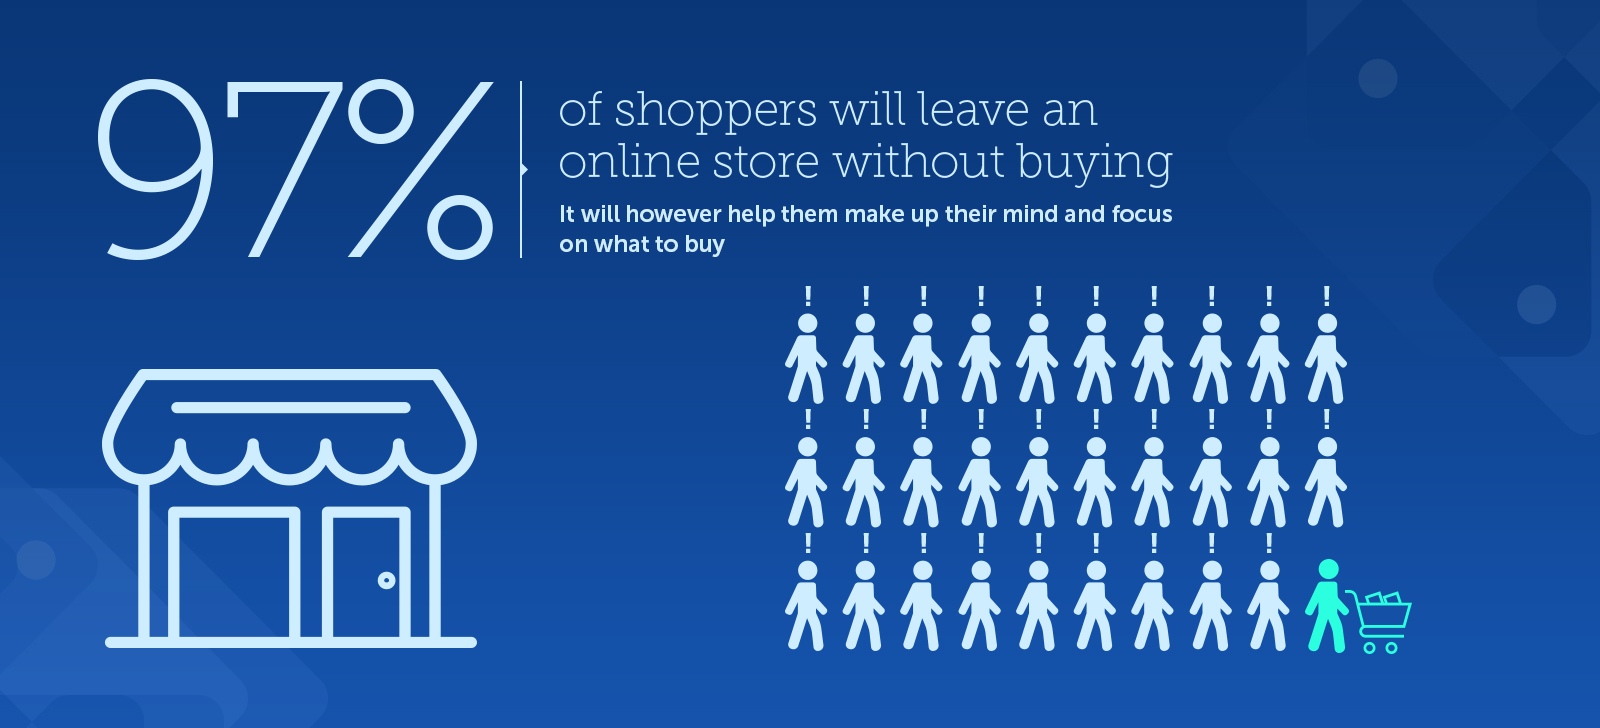
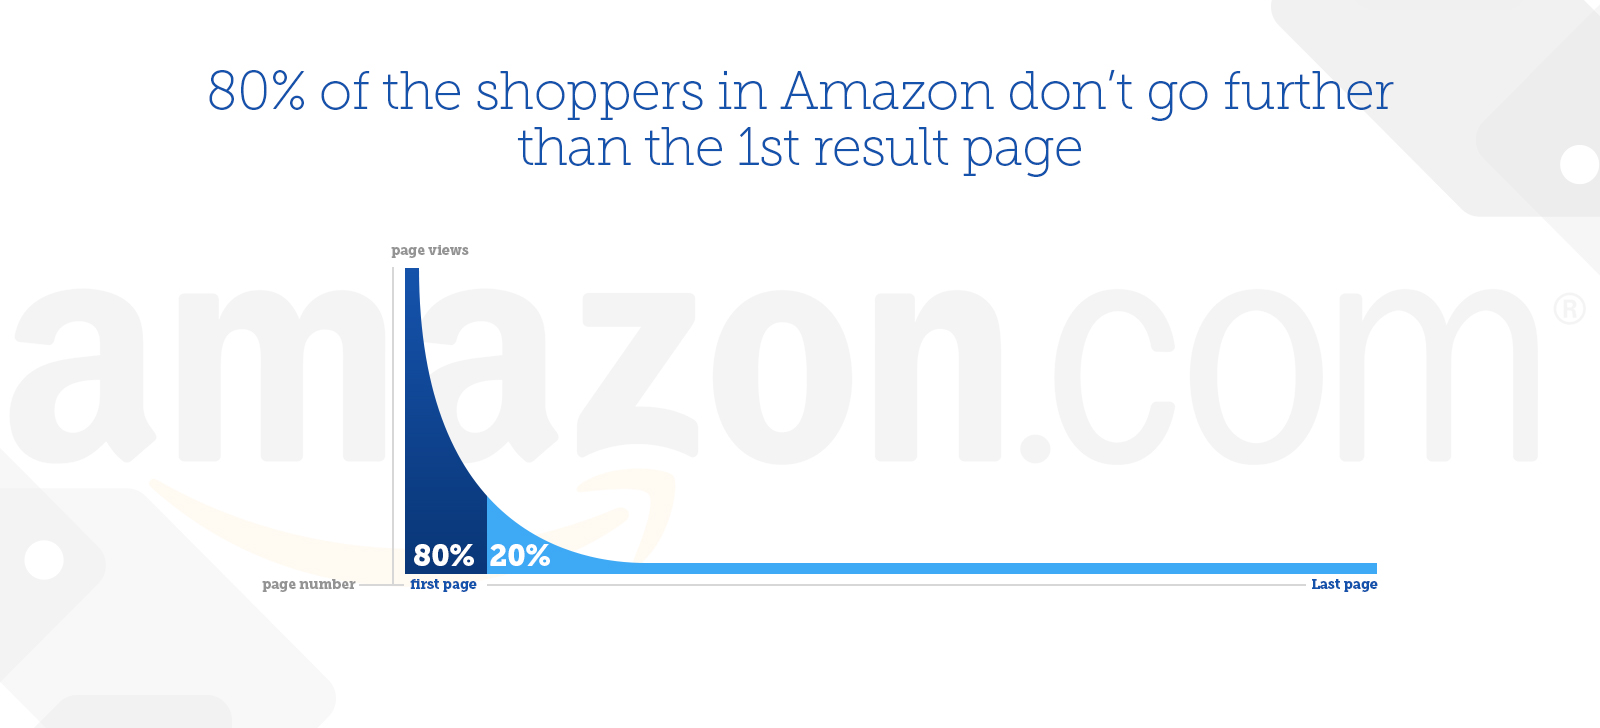
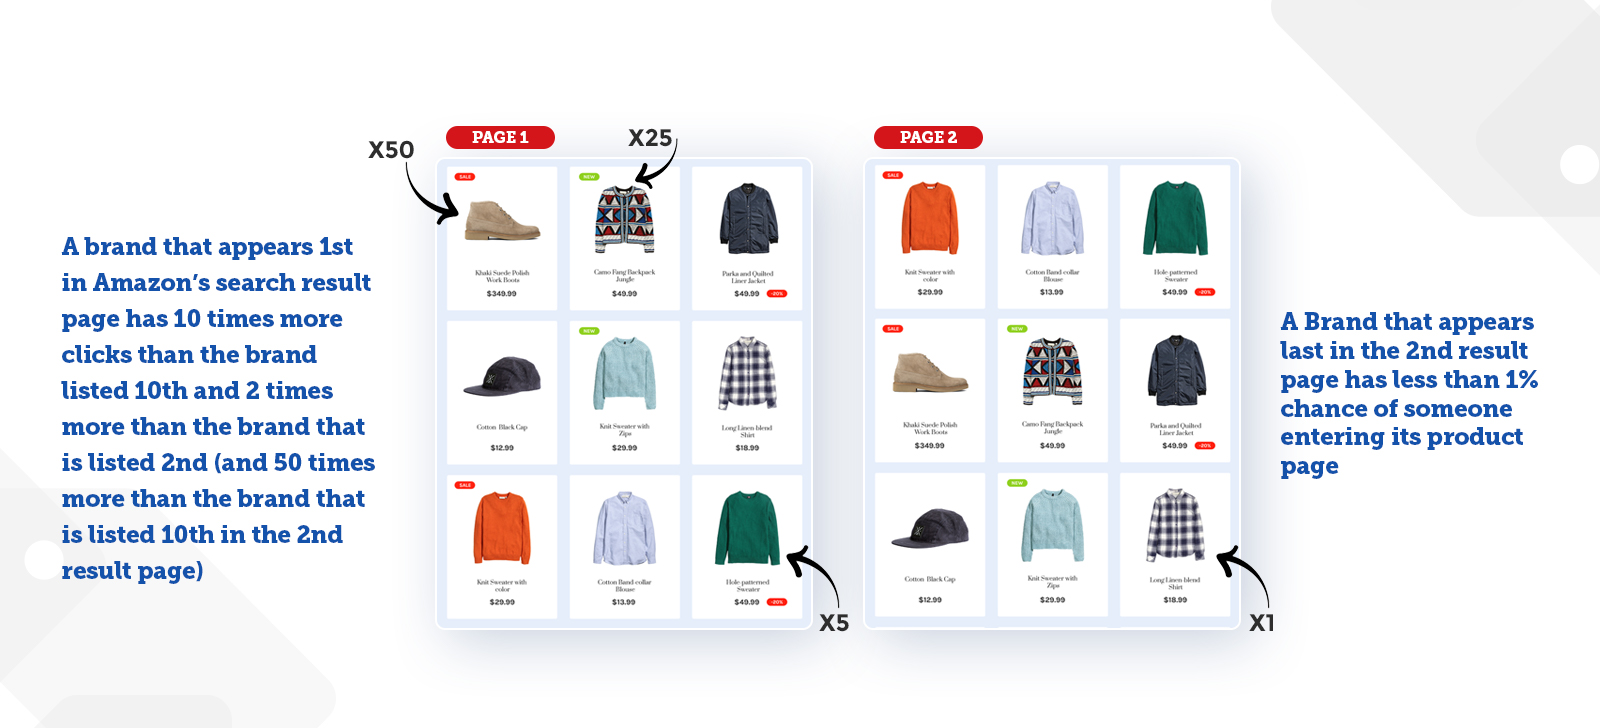
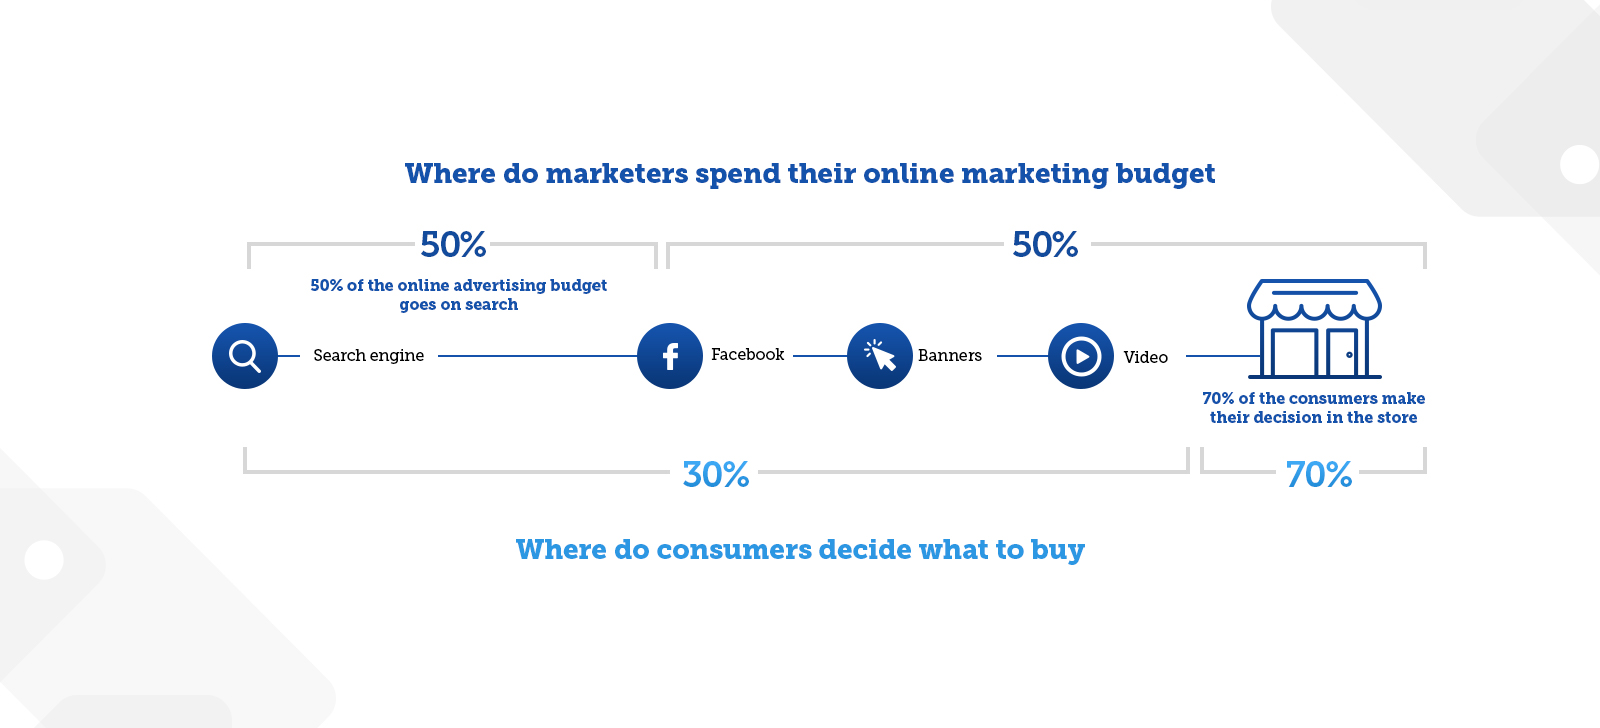
We have gathered some interesting information and stats about eCommerce, consumers behavior, advertising and other interesting related stuff and turned it into these 7 infographics.
You can download it as a PDF (link below)

Download Infographics as a PDF file: 
Sources:
- https://www.thinkwithgoogle.com/articles/owning-the-digital-shelf.html
- http://www.wpp.com/wpp/marketing/consumerinsights/shopper-decisions-made-instore/
- http://www.marketingprofs.com/chirp/2014/25779/state-of-search-results-budgeting-trends-infographic
- https://blog.compete.com/2014/11/17/brands-searching-success-amazon/
- https://blog.compete.com/2014/11/10/five-things-every-cpg-brand-needs-win-online/
- https://www.mabaya.com/category/blog/